Gone are the days when trading involved spending a lot of time looking at the screens of our smart devices to see how the market or financial assets are performing. The arrival of web trading platform has eased this struggle. They come with facilities like analyzing the performance based on your requirements. They also come with a unique feature of customizing the way the readings can be presented based on your interests.
What is TradingView?
TradingView Live is an online platform dedicated for trading of financial assets like stocks and cryptocurrencies. It comes with facilities like setting alerts when a market’s performance meets your specific interests or goals or even presenting the data the way a user desires in the form of charts. It is highly customizable, so whatever you are looking for, right from getting alerts about the market’s performance to even coming up with your own way of presenting data for analysis, TradingView has got you covered. Although it is used on a desktop and laptops, this platform is also available on iOS and Android devices.
What Makes TradingView’s Drawing Tools Unique?
Drawing tools are those tools used in creating a chart that presents the data. These charts are frequently used for analysis to understand the market better. While such tools are available in all trading platforms, TradingView’s drawing tools are easy to use as they work. Whether you are new to trading or if you are an experienced trader, TradingView is loaded with a variety of drawing tools that allows you to present data based on your preferences.
How To Use Drawing Tools?
The tool works based on a click, drag, and drop mechanism. To do so, open a chart and choose any tool located in the left side of the panel. Select a tool with a click, hold and drag, and you will notice that the selected coverage is highlighted. Lastly, you can customize it based on color, thickness etc.
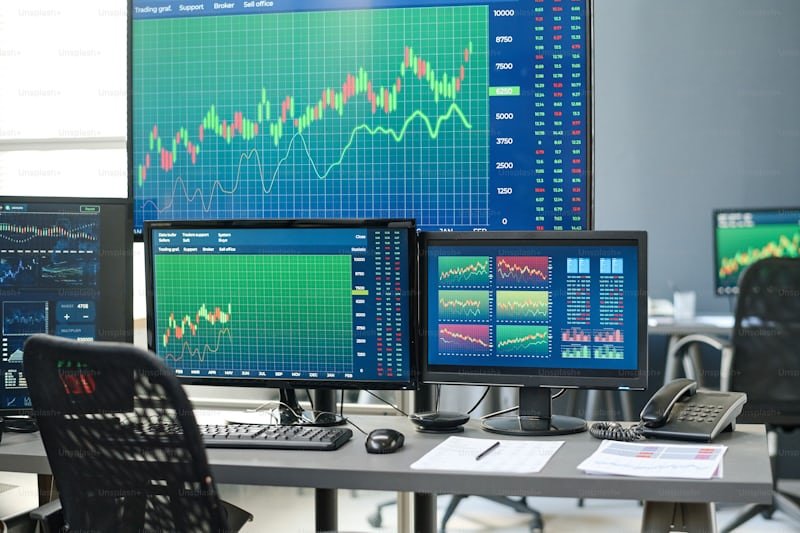
How Can Charts Help in Trading?
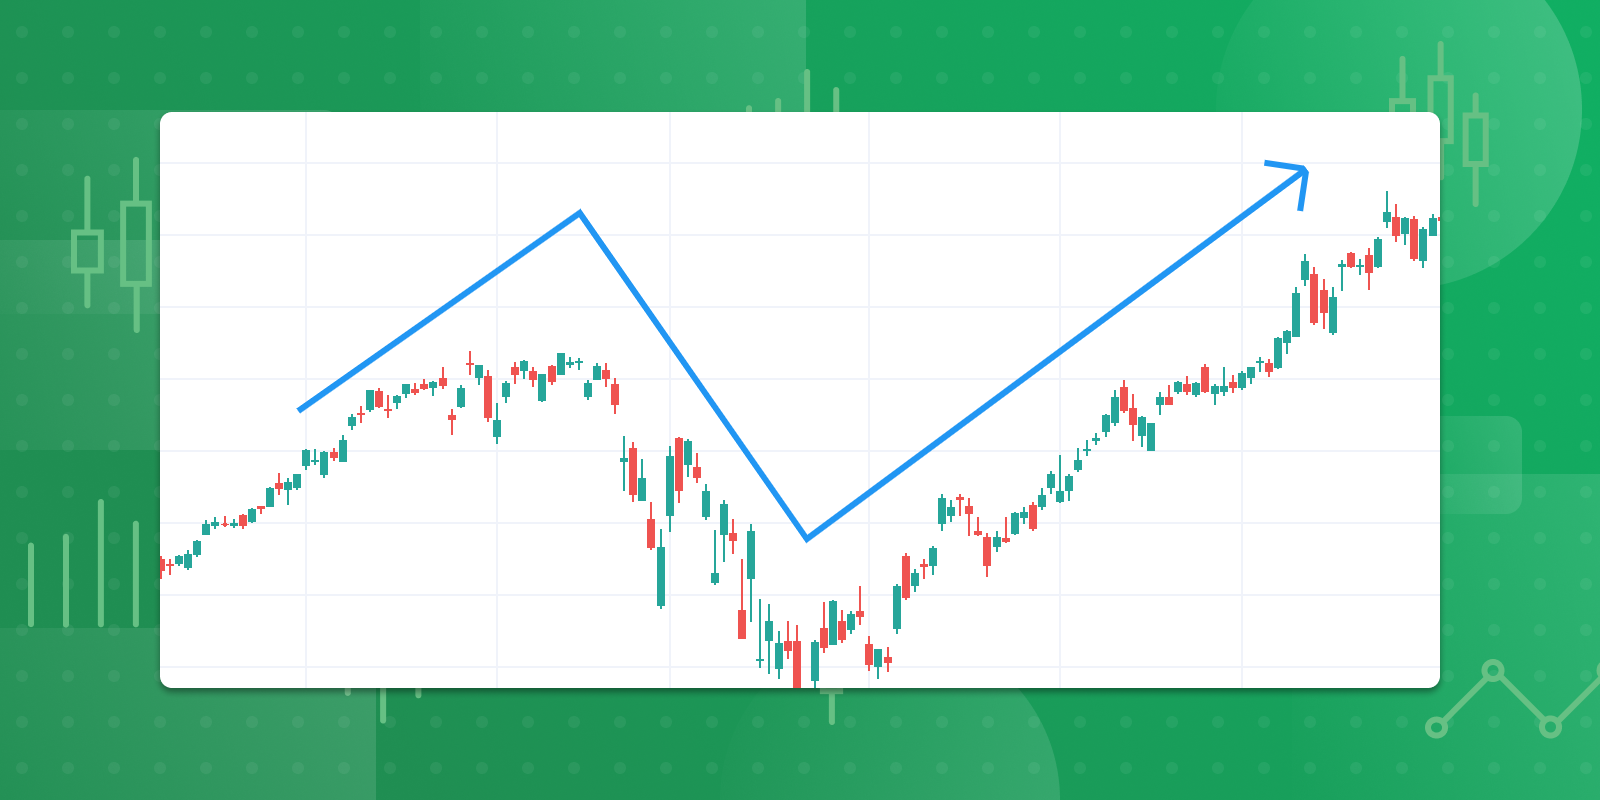
Trading in financial assets is beyond buying, holding, and selling. It also involves analyzing their performance using tools and charts to give a better idea about what kind of decisions can be taken in the future that involve such financial assets. Trading charts help understand prices and their trends. They come with relevant information required while buying, holding, and selling any financial asset. Patterns are classified into different categories for the better understanding of the traders, brokers, and analysts.
Conclusion
Online trading charts can help predict how the market is going to perform in the future. They come with tools to analyze and present the data according to your interests, needs and wants. There are different types of trading platforms available that come with such tools, but TradingView gives you the opportunity to customize the way data is presented to you. To know more about trading, reading charts and interesting ways to present them using the best drawing tools available, download Dhan, and leverage the most out of online trading.