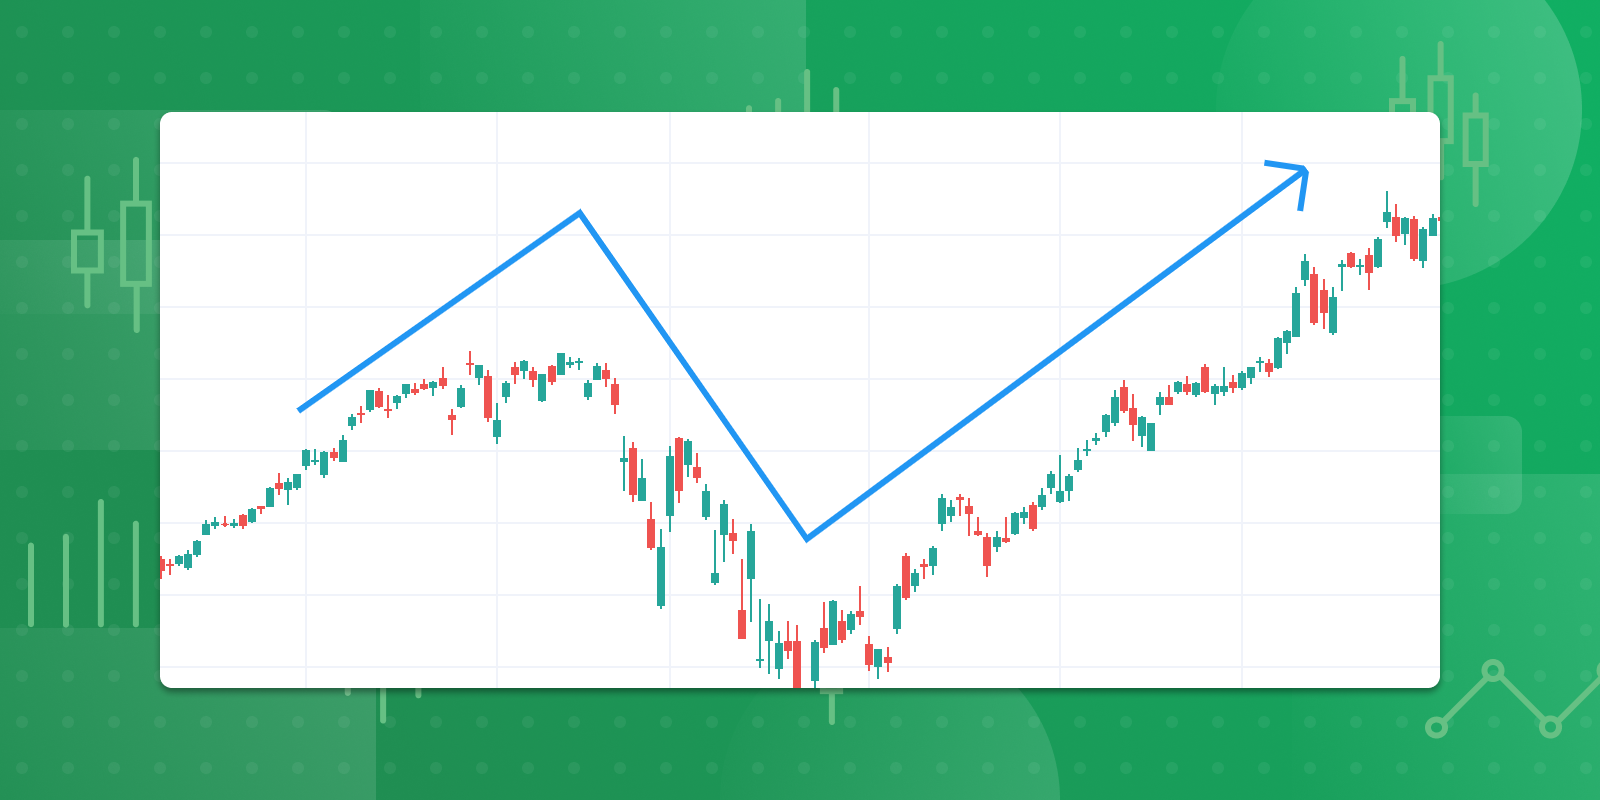
The stock market is all about investing in the right stocks at the right time. But, how can you identify the right stocks and the right time to trade or invest in them? Well, for this, all traders and investors make use of something called the market indicators. These indicators help you get a nerve out of the market’s direction and help you predict the upcoming movements accurately!
5 Must-Know Stock Market Trading Indicators
To establish the right trades on a stock trading platform, you must use market indicators. Trading indicators fall under two categories, namely Leading Indicators and Lagging Indicators. Now, let us read about 5 indicators that you must track on a stock trading platform.
- Moving Average (MA)
Moving the Average of a stock helps you detect or identify the direction of its current price. The Moving Average, also known as Simple Moving Average (SMA), is used to combine the price points of a financial instrument over a specified time frame and divide it by the number of points of data to present only a single trend line. This helps you know the future price trajectory of the stock. If you track this for key indices, you can get to know the market’s direction.
- Exponential Moving Average (EMA)
Exponential Moving Average (EMA) is another type of moving average. It is used to put more significant weightage on the recent data points, making the data more responsive to the new information. The EMAs for the short-term are most probably 12 26- days, whereas for the long term, it is 50-and 200-days.
- Stochastic Oscillator
A Stochastic Oscillator is a known indicator that compares a specific closing price and a range of prices of a security over time, which provides you with momentum and trend strength. It is measured on a scale range of 0 to 100. If the reading is below 20, then it generally indicates an oversold market, and if the reading shows above 80, then it represents an over
bought market.
- Bollinger Bands
A Bollinger Band is used to provide a range for trading the asset’s price. The width of the Bollinger Band increases and decreases to reflect the recent volatility of the trade. When we find that the bands are closer to each other, then it is assumed that the volatility of the financial asset is low, whereas on the other hand, if the band is wider, the volatility of the asset is assumed to be high.
- Relative Strength Index (RSI)
Traders use the Relative Strength Index (RSE) to identify the market conditions and momentum and the warning signs of dangerous movements in the price. RSI is found between 0 to 100. If the RSE of an asset is 70, it is found to be overbought, and if the asset is found nearby 30, then it is considered oversold.
Conclusion
Trading Indicators are important as they help traders and investors to strategise their bets in the market better. They are a part of the technical analysis of the financial instruments and are backed by logic. Whether you are a beginner or an experienced player on a share trading app, you must use these indicators and make informed trading decisions.


